Smartphone Market Statistics 2026: Shipments, Brands & Prices
-
 Written by
Rajat Singh
Written by
Rajat Singh
- Published
- Updated
- Read time 14 min read
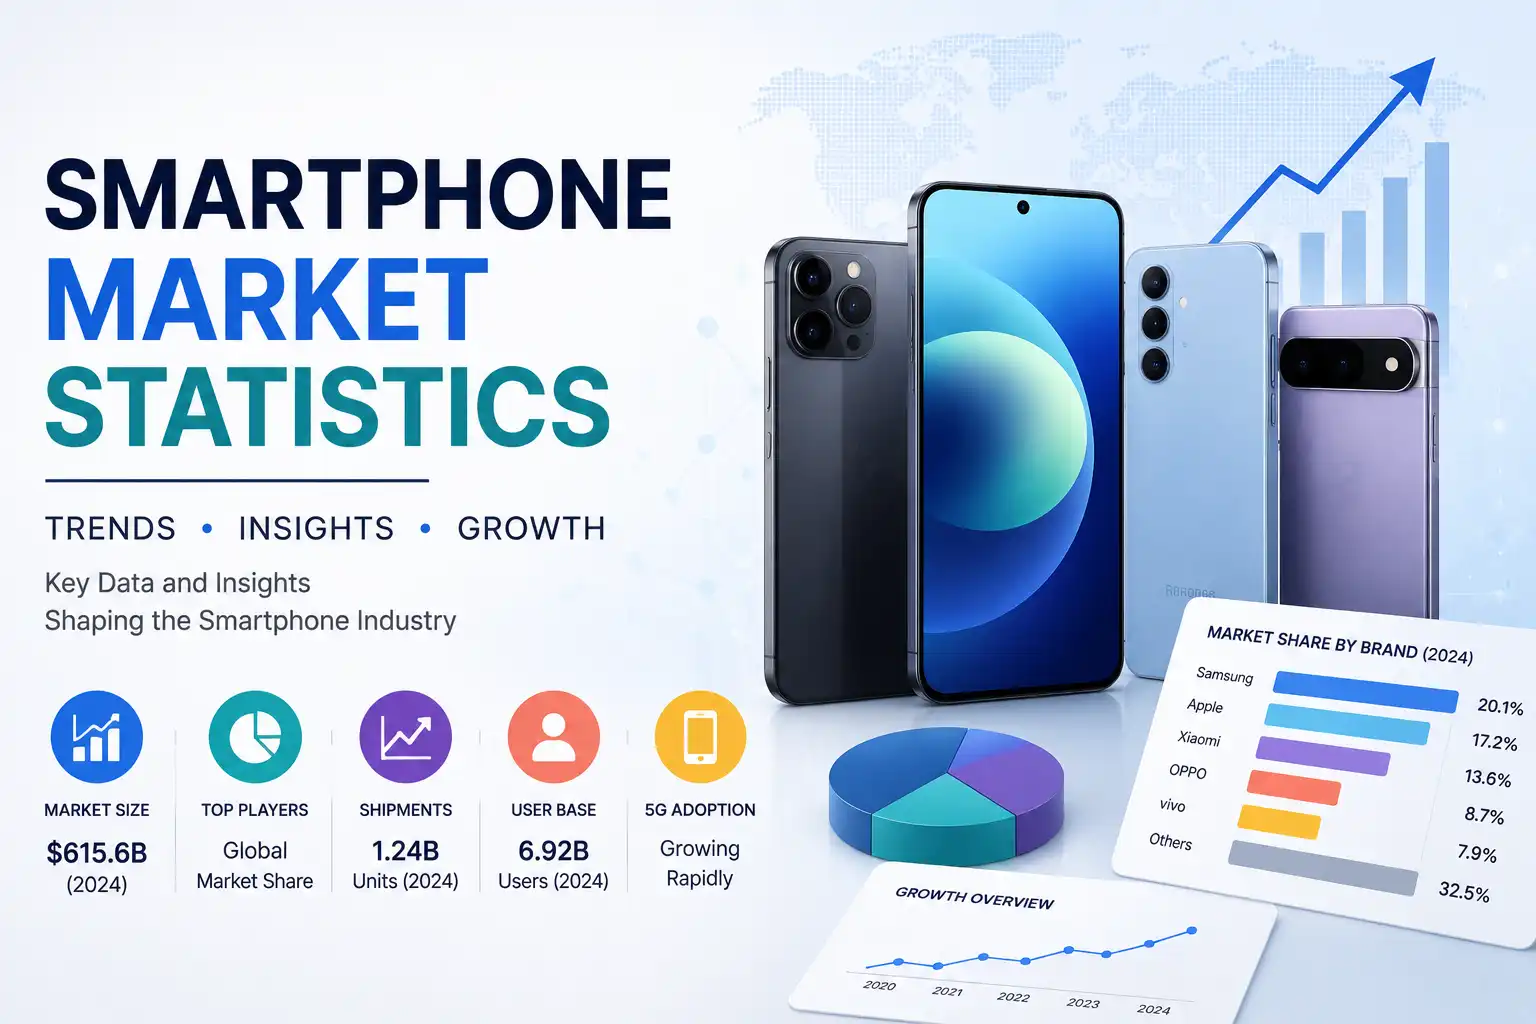
Global smartphone shipments are on track for the steepest annual contraction in the industry’s entire history, down 12.2 to 13.9% in 2026 depending on which tracker you check. At the exact same time, the total value of that shrinking market is still projected to grow 6.1%. Fewer phones are actually shipping, and the industry as a whole is making more money doing it.
On This Page 11 sections
That’s not a contradiction, it’s a single, traceable cause. A memory chip price crisis has pushed the global average smartphone selling price up 21% in a single year, the largest jump in both percentage and dollar terms the industry has ever recorded. Here’s the real, sourced data behind that shift, and behind who’s actually winning the brand race in a market that’s genuinely reshaping itself in real time, from the chips inside every phone down to how long people actually keep the one they already own.
- Global smartphone shipments are forecast to fall 12.2 to 13.9% in 2026, to roughly 1.09 billion units, the steepest annual contraction ever recorded for the category, per IDC and Omdia.
- Average selling price is jumping from $467 in 2025 to $565 in 2026, a 21% increase, driven by a DRAM and NAND memory price spike of more than 80% quarter over quarter in early 2026.
- Samsung and Apple are running neck and neck for the global top spot, both around 21 to 22.6% share depending on the quarter and tracker, with Counterpoint and IDC actually disagreeing on which one currently leads.
- India’s leaderboard looks completely different from the global one, Vivo led with 18.4 to 21% share across 2026’s first two quarters, ahead of Samsung, OPPO, Xiaomi, and Realme, while India’s overall shipments are expected to fall 10 to 12% for the year.
- Foldable phones are still a small slice of the market, roughly 2.5% of global shipments, but growth forecasts for 2026 range from 30% to 50% year over year, with Apple’s first foldable iPhone expected to accelerate that further in its debut year.
IDC, Omdia. Checked August 2026.
A Market Shipping Fewer Phones and Making More Money
IDC forecasts worldwide smartphone shipments falling 13.9% in 2026 to 1.09 billion units, a decline the firm itself calls the steepest annual contraction in smartphone history. Omdia’s separate figure puts total volume loss at 152 million fewer units shipped in 2026 specifically.
Yet total market value is still projected to grow 6.1% year over year over that same period. That divergence, fewer units and more total revenue, is only possible because the average price per phone climbed sharply enough to more than offset the volume drop, and that price increase traces to one specific, dated supply chain event rather than general inflation across the category.
Why Every Phone Costs More Right Now
Global average selling price is forecast to jump from $467 in 2025 to $565 in 2026, a $98 increase and a 21% jump, the largest single year ASP move, in both percentage and dollar terms, the smartphone industry has ever recorded.
Omdia global smartphone ASP forecast. Checked August 2026.
The direct cause is a genuine, dated memory chip supply crunch, not general inflation across the wider consumer electronics category. DRAM and NAND flash memory prices rose more than 80% quarter over quarter during the first quarter of 2026 alone, and every smartphone ever made, regardless of brand or price tier, requires both component types simply to function at all, the same shortage behind the price jumps covered in the laptop market too. That cost increase flows straight through into the retail price of every single phone shipped afterward, with no real way for a manufacturer to fully absorb it.
Samsung and Apple Are in a Genuine Dead Heat
The global brand leaderboard for 2026 is closer than it’s been in years, close enough that different research firms don’t even agree on who’s actually winning. IDC’s Q1 2026 data put Samsung first at 21.2% share with 62.4 million units shipped, against Apple’s 21.0% share and 61.8 million units, a gap of just 0.2 percentage points. Counterpoint Research’s own Q1 measurement instead put Apple in first place at 21% specifically.
IDC Q2 2026 global smartphone market share. Xiaomi’s Q2 share figure is its most recently confirmed quarter, shown alongside Q2 Samsung and Apple data for the clearest single quarter comparison. Checked August 2026.
Xiaomi held a clear third place globally through the first half of 2026, but its own trajectory moved sharply worse between quarters, shipping 33.8 million units in Q1 before falling to 31.2 million units in Q2, a 26.3% year over year decline in that second quarter specifically. That’s a genuinely steep single quarter drop for a top 3 global brand, and a real sign the memory cost pressure covered earlier is hitting mid tier focused brands harder than the two premium leaders.
India’s Brand Leaderboard Looks Nothing Like the Global One
Neither Samsung nor Apple leads India specifically, a real, consistent divergence from the global picture covered above. Vivo held the top spot through both of 2026’s first two quarters, with Samsung, OPPO, Xiaomi, and Realme filling out the rest of the top 5 in that order both times.
| Brand | Q1 2026 Share | Q2 2026 Share | Q2 YoY Change |
|---|---|---|---|
| Vivo | 21% | 18.4% | -13.9% |
| Samsung | 17% | 16.4% | Declined (India overall) |
| OPPO | 14% | 13.8% | -8.5% |
| Xiaomi | 12% | 9.7% | -10% |
| Realme | 10% | 9.3% | -14.2% |
Counterpoint Research, CMR India smartphone market share tracking, Q1 and Q2 2026. Checked August 2026.
The quarter over quarter pattern is worth reading closely rather than just the rankings. In Q1, OPPO actually grew 12% year over year while Vivo, Samsung, Xiaomi, and Realme all posted declines, OPPO was the one clear bright spot. By Q2, every single one of the top 5 brands had swung to a year over year decline, OPPO included, down 8.5%, a real sign the pricing pressure from the memory chip crisis widened rather than concentrated in specific brands as the year progressed.
India’s overall smartphone shipments are expected to fall 10 to 12% for full year 2026, directly attributed to rising prices from the same memory chip cost increase covered earlier in this piece, not weakening demand on its own. Shoppers comparing prices across Amazon, Flipkart, and Vijay Sales specifically are seeing that cost increase reflected directly in this year’s pricing, a genuinely different market than the one from even a year earlier.
The Chip Inside Matters as Much as the Brand on the Box
The same memory cost pressure reshaping brand rankings is playing out one layer deeper, in the processors that actually power these phones. MediaTek leads the global chipset market at 32% share in Q1 2026, but that’s down sharply from 38% a year earlier. Qualcomm sits second at 23%, down from 27%, while Apple’s own silicon climbed to 19% share, up from 15%.
| Chipmaker | Q1 2025 Share | Q1 2026 Share |
|---|---|---|
| MediaTek | 38% | 32% |
| Qualcomm | 27% | 23% |
| Apple silicon | 15% | 19% |
Counterpoint Research global smartphone chipset shipment share. Checked August 2026.
MediaTek’s decline traces directly back to its own core strength, a heavy concentration in entry level and mid tier chipsets, exactly the price segment the memory cost spike is squeezing hardest. Qualcomm’s drop has a second, separate cause layered on top, Samsung’s own Galaxy S26 series launched with some models running Samsung’s in house Exynos 2600 chipset instead of Qualcomm’s Snapdragon silicon, pulling real volume away from Qualcomm independent of the broader memory story.
Apple’s gain is the cleanest read of the three. Strong demand for the iPhone 17 lineup, including the iPhone 17e running Apple’s own A19 chip, pushed Apple’s chipset share up specifically while its two biggest rivals both declined in the same quarter, the component level version of the same premium brand advantage covered earlier in this piece.
Buyers Are Turning to Refurbished Phones Instead
Rising new phone prices are pushing real, measurable demand toward the secondhand and refurbished market, a direct consumer response to the pricing pressure covered throughout this piece. Refurbished and used mobile phone sales already accounted for nearly 23% of total global smartphone sales in 2023, more than 310 million units, and the category has kept growing since.
The global refurbished smartphone market is valued between $77 billion and $88.78 billion depending on the tracker for the current period, projected to roughly double to somewhere between $134.6 billion and $209 billion by 2033, growing at an 8 to 11.3% compound annual rate. India specifically is projected to grow even faster, at a 14.5% CAGR from 2026 to 2033, fueled by expanding UPI digital payments adoption and a mobile broadband subscriber base of roughly 969 million people.
Platforms like Cashify and Yaantra already process more than 5 million refurbished phone transactions annually in India alone, a real, substantial secondary market running alongside the new phone sales covered in the rest of this piece. As new phone ASPs keep climbing on the back of memory costs, that refurbished channel is positioned to keep absorbing buyers who’d rather not pay the new premium, a real structural release valve the shrinking new phone market doesn’t have built into it.
People Are Also Simply Holding Onto Phones Longer
The average global smartphone replacement cycle has stretched from 2.4 years in 2013 to somewhere between 3.5 and 4 years in 2026 depending on the source, a genuinely long term, multi year trend rather than a sudden 2026 shift, though it compounds directly with everything else covered in this piece. Premium phone owners in the US specifically now hold their devices an average of 42 months before replacing them, up from 38 to 40 months in prior years.
Two separate forces are driving that lengthening cycle. Rising component costs, the same memory price story covered throughout this piece, make each new phone a bigger financial commitment relative to sticking with an existing one, which makes knowing the best time to buy electronics matter even more than it used to. At the same time, incremental year over year hardware improvements have made older phones genuinely more capable for longer, giving both buyers and manufacturers less urgency to force an upgrade than in the smartphone category’s earlier years.
That combination, longer replacement cycles plus a growing refurbished market plus the memory driven price spike, adds up to the same conclusion from three completely independent angles, fewer new phone transactions happening across the entire industry in 2026, exactly the shipment contraction covered at the very start of this piece.
Vendors Are Retreating From Entry Level Phones
Rising memory costs are pushing smartphone makers to deliberately reduce how many entry level devices they build, since the fixed memory cost increase eats a much larger share of a budget phone’s total price than a premium one’s. Vendors are instead shifting production toward mid range and premium tiers specifically to protect their margins.
Apple has captured 65% of the entire global premium smartphone market, per one industry tracking source, a genuinely dominant position in the segment vendors are now actively competing hardest to win. Premiumization, deeper ecosystem lock in through services and accessories, and higher margin software revenue are expected to become the primary growth drivers for the entire smartphone industry over the next several years, a real, structural shift away from the volume driven growth model the category relied on for most of the past decade.
Foldables Are Still Small, But Growing Fast
Foldable phones remain a genuinely small slice of the overall market, roughly 2.5% of global smartphone shipments, with Greater China leading regional adoption at 3.2% share and North America trailing well behind at 1.2%. But the growth rate attached to that small base is real and substantial, forecasts for 2026 range from 30% year over year up to 50% depending on the research firm.
Book type foldables (the larger, tablet like fold) versus flip type share of total foldable shipments. Checked August 2026.
Apple’s own entry into the category is the single biggest near term catalyst. The company’s first foldable iPhone is expected to launch in late 2026, and IDC predicts Apple will capture 22% of the entire worldwide foldable device market by unit share in its very first year, and an even larger 34% share of total foldable market revenue, a real sign Apple’s foldable is expected to enter at a premium price point well above the category average from day one.
Huawei currently leads global foldable shipments with roughly 48% share as of Q2 2026, though Samsung grew a real 25% in the same quarter, the two clearest foldable specialists heading into a market Apple is about to enter directly for the first time.
What All of This Actually Means Right Now
None of the numbers in this piece point toward a settled, stable market. Shipments are contracting at the fastest rate the category has ever recorded, prices are rising at the fastest rate the category has ever recorded, and two of the biggest brands in the world are separated by a fraction of a percentage point globally while an entirely different pair of brands leads the race in India specifically.
Every secondary trend covered in this piece, refurbished phones absorbing priced out buyers, replacement cycles stretching longer, entry level chipmakers losing ground to premium ones, ultimately traces back to that same single root cause rather than standing as separate, unrelated stories.
The single thread running through all of it is the memory chip cost spike covered in this piece, it’s driving the price increases, the entry level pullback, the premium segment’s growing dominance, and even part of why mid tier brands like Xiaomi are losing ground faster than premium focused ones. For real, current pricing and codes across the brands covered in this piece, browse our full mobiles category, updated as offers change.
Frequently Asked Questions
Are global smartphone shipments actually falling in 2026?
Yes, significantly. IDC forecasts a 13.9% decline to roughly 1.09 billion units, which the firm describes as the steepest annual contraction in smartphone history. A separate Omdia estimate puts the total volume loss at 152 million fewer units shipped in 2026.
Why are smartphones getting more expensive in 2026?
A memory chip supply crunch. DRAM and NAND flash memory prices rose more than 80% quarter over quarter in early 2026, and since every smartphone requires both component types, that cost increase flows directly into retail prices across every brand and price tier.
Which brand actually leads the global smartphone market?
It genuinely depends on which tracker you check. IDC’s Q1 2026 data put Samsung narrowly ahead of Apple, 21.2% versus 21.0%, while Counterpoint Research’s own Q1 measurement put Apple in first place instead. By Q2, IDC had Samsung clearly ahead at 22.6% versus Apple’s 20%.
Which smartphone brand leads in India?
Vivo, consistently through both of 2026’s first two quarters, holding 18.4 to 21% share ahead of Samsung, OPPO, Xiaomi, and Realme. That’s a genuinely different leaderboard than the global one, where neither Vivo nor OPPO nor Realme place in the worldwide top 3.
How much of the smartphone market do foldable phones make up?
Roughly 2.5% of global shipments as of 2026, still a small slice of the overall market. Growth forecasts for the category range from 30% to 50% year over year for 2026 though, with Apple’s first foldable iPhone, expected in late 2026, seen as a major additional catalyst.
Is India’s smartphone market shrinking in 2026?
Yes, shipments are expected to fall 10 to 12% for the full year, attributed directly to rising prices from the global memory chip cost increase rather than weakening underlying demand. Every major brand in India’s top 5 posted a year over year shipment decline by Q2 2026.
Why is Apple gaining share in the premium segment specifically?
Apple’s stronger balance sheet lets it absorb higher memory costs without passing the full increase to buyers, and the company already holds roughly 65% of the global premium smartphone segment by one industry estimate, a dominant position other vendors are now competing hardest to challenge as the whole industry shifts toward premiumization.
Which chipmaker leads the smartphone processor market?
MediaTek, at 32% share in Q1 2026, though that’s down from 38% a year earlier due to its heavy exposure to entry level chipsets, exactly the segment memory costs are squeezing hardest. Qualcomm sits second at 23%, also declining, while Apple’s own silicon climbed to 19%, up from 15%.
Is the refurbished phone market actually growing?
Yes, substantially. Refurbished and used phones already made up nearly 23% of total global smartphone sales in 2023, and the global refurbished market is projected to roughly double by 2033. India’s refurbished market is growing even faster, at a projected 14.5% CAGR through 2033.
How long do people actually keep their smartphones before upgrading?
The global average has stretched from 2.4 years in 2013 to somewhere between 3.5 and 4 years in 2026, depending on the source. US premium phone owners specifically now average 42 months, up from 38 to 40 months in prior years, driven by both rising prices and phones simply staying capable for longer.