The Impact of Inflation on Coupon Availability: What Actually Happened
-
 Written by
Rajat Singh
Written by
Rajat Singh
- Published
- Updated
- Read time 15 min read
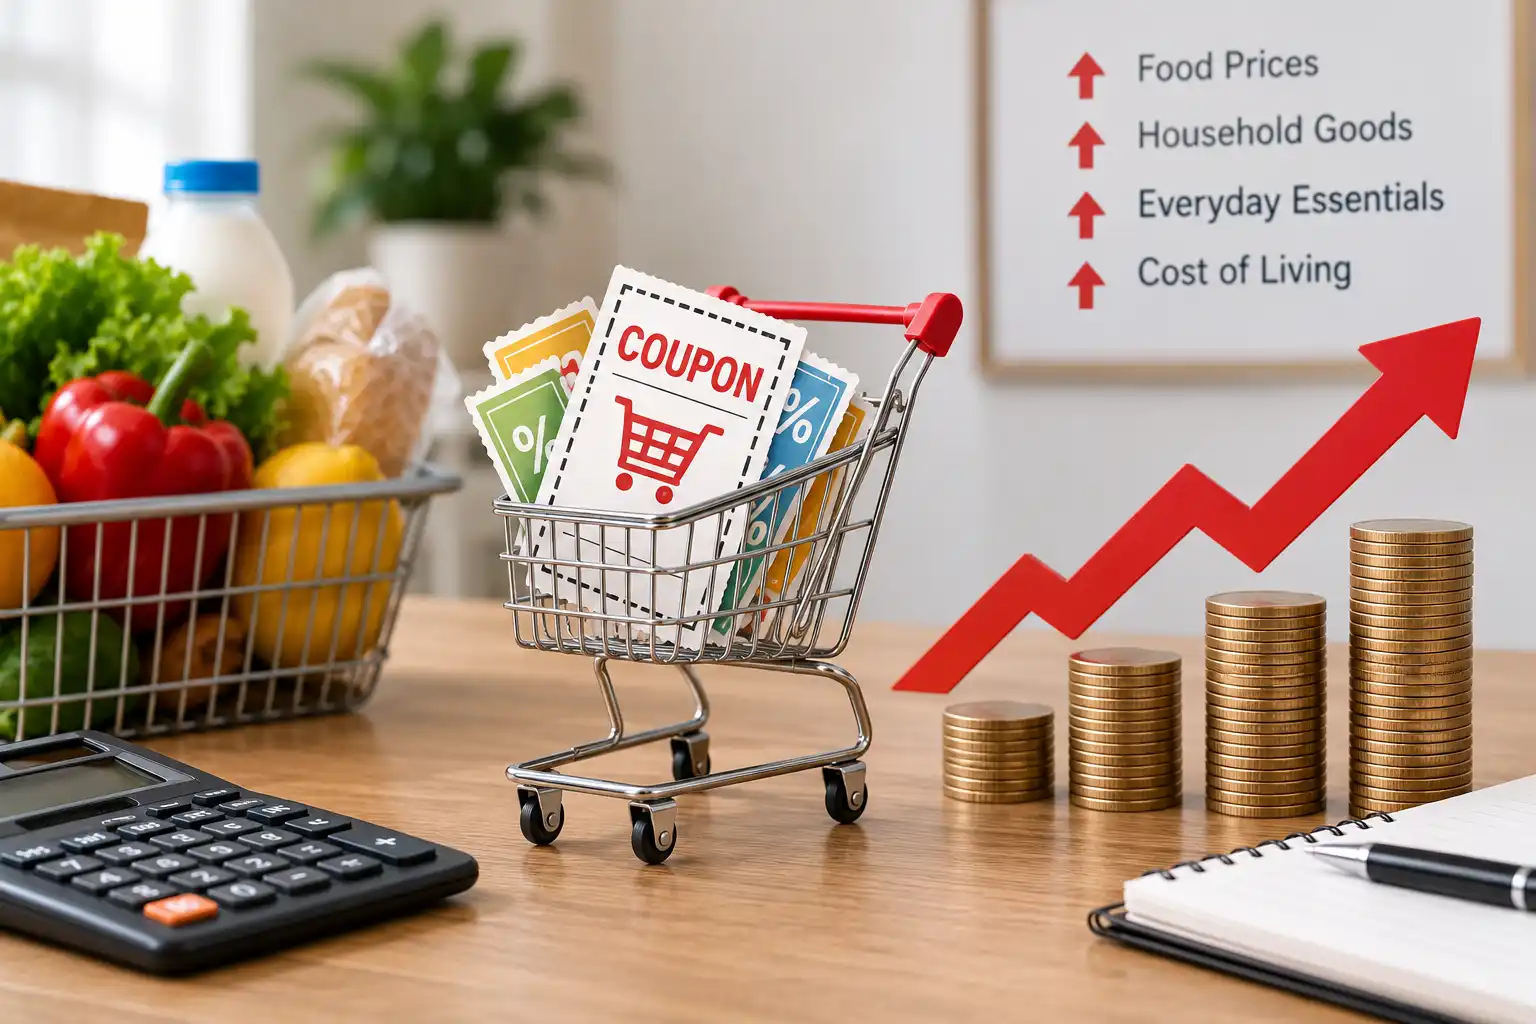
The common assumption is straightforward, rising prices squeeze retailer margins, so coupons get scarcer and smaller during inflation. The real data from the 2022 to 2024 inflation cycle shows close to the opposite happened, and by a wide enough margin that it’s worth walking through the actual numbers rather than repeating the assumption.
On This Page 9 sections
Coupon redemption had declined for 12 straight years before 2023. Then, right as food inflation peaked at 13.6% in January 2023, redemption reversed and grew for two consecutive years, and the average discount on food coupons specifically got bigger, not smaller. This guide covers what actually happened, backed by real industry tracking data rather than the assumption that inflation simply shrinks couponing.
- Food price inflation peaked at 13.6% in January 2023, the highest level in over four decades. Coupon redemption had been declining for 12 straight years before that, then reversed and grew in both 2023 and 2024.
- The average face value of a food coupon rose to $2.74, up 57% year over year, as brands offered deeper discounts specifically to retain price sensitive shoppers, not shallower ones.
- Digital coupon redemption jumped 31% in 2023 to its highest level ever recorded, and digital passed paper as the single most used redemption method for the first time in 2025.
- 25% of US adults said they were using more coupons because of the economy in 2024, up from 18% in mid 2021, according to the National Retail Federation.
- Brand switching for better prices genuinely accelerated too, 49% of consumers had switched to less expensive brands by November 2024, up from 47% at the start of that same year.
USDA Economic Research Service, Inmar Intelligence Promotions and Shopper Behavior Trends reports, and National Retail Federation survey data. Checked August 2026.
The Real Coupon Redemption Trend Through Inflation
Coupon redemption in the US fell every year for over a decade, from 1.05 billion coupons redeemed in 2020 down to 789 million in 2022, alongside a redemption rate that dropped from 0.89% in 2015 to just 0.47% in 2022. That’s the real backdrop inflation hit, an industry already in a long, steady decline, not a stable baseline suddenly disrupted.
That decline had genuine structural causes behind it too, not just waning interest. Rising online shopping, subscription based purchasing, and app based loyalty pricing had all been quietly replacing the clip and redeem model well before inflation became the dominant economic story, which makes the 2023 reversal even more notable, it happened despite those same structural pressures still being fully present, not because any of them went away or eased up.
Total US coupons redeemed, selected years. Inmar Intelligence Promotions and Shopper Behavior Trends reports.
The turn happened at almost exactly the moment food inflation peaked. Redemption rose 10% in 2023 and another 3% in 2024, the first two consecutive years of growth after twelve straight years of decline. Brands facing shoppers actively hunting for savings had a real incentive to bring couponing back rather than let it keep fading.
This Isn’t the First Time
The 2022 to 2024 reversal actually matches a much older, well documented pattern rather than being a surprising new phenomenon. Inflation ran above 6% for the entire decade of the 1970s, peaking above 11% in 1974 and 13% in 1980 during the stagflation era, and by the mid 1970s, roughly 65% of US households were actively clipping coupons, a surge that tracked directly with that decade’s inflationary pressure.
The pattern repeating in 2023 and 2024 isn’t an anomaly, it’s coupons doing the exact job they’ve historically done during a period of rising prices. Treating the recent inflation cycle as unprecedented misses that the actual historical relationship between inflation and couponing runs the opposite direction from what the outdated assumption claims, and has for at least two separate, decades apart economic cycles now.
How Individual Retailers Actually Responded
The response looked genuinely different retailer by retailer, not like one uniform industry playbook. Target cut prices outright on 5,000 frequently shopped items in spring 2024, then added another 2,000 cuts heading into that year’s holiday season, a direct price reduction rather than a coupon.
Walmart leaned harder into promotions specifically, offering roughly 2.5 times more promotional codes than Target across a nearly two year stretch from September 2023 through June 2025, while Target relied more on a consistent, standing 5% discount tied to its Circle loyalty card. Kroger’s real savings showed up mainly through rotating member specific coupons rather than standard shelf pricing, meaning a shopper comparing sticker prices alone across these three retailers would have missed most of the actual competitive discounting happening underneath.
None of the three approaches is inherently better, they’re genuinely different bets on what keeps a price sensitive shopper loyal. A permanent price cut is simple and requires no extra effort from the shopper, a standing loyalty discount rewards app usage specifically, and rotating member coupons ask for more active engagement in exchange for a potentially larger individual discount. Knowing which model a specific retailer uses changes where it’s actually worth spending the extra few minutes to look for a deal, rather than assuming the same search strategy works identically everywhere.
Coupon Availability, Not Just Redemption
Redemption measures what shoppers actually used. Availability, how many coupons actually got issued in the first place, is a genuinely separate number, and it tells a similar story. 100.7 billion coupons were distributed in the US in 2023 alone, and the coupon industry generated $4.6 billion in real consumer savings that same year.
The format mix moved fast too. In 2023, paper still accounted for 84.3% of coupons issued against 15.7% digital, but by 2024 digital’s share of newly issued coupons jumped to 33.5%, up 113.6% year over year, more than doubling in a single year while paper’s share fell to 66.5%. Availability didn’t shrink during this period, it grew and changed format simultaneously.
That issuance mix looks almost backward compared to the redemption mix, where digital already made up the majority of coupons actually used. Both numbers are real and consistent with each other once you separate them properly, paper still gets printed and distributed in far larger raw volume, but a much smaller share of it ever gets used, while a much higher share of every digital coupon issued actually gets redeemed. Availability and effectiveness are two different measurements, and conflating them is exactly how a claim like “coupon distribution fell during inflation” gets repeated without anyone checking which specific number it’s actually describing.
Discount Values Went Up, Not Down
The assumption that inflation forces smaller, stingier discounts doesn’t hold up against the actual data on food coupons specifically. The average face value of a food coupon rose to $2.74, up 57% year over year, and because the average purchase requirement dropped to 1.4 units at the same time, the effective per unit value rose even more, up 75% to $1.92.
That doesn’t mean every category behaved the same way. Discretionary categories, apparel and consumer electronics among them, did see real margin pressure and more conservative promotional budgets, since shoppers weren’t price shopping those categories with the same urgency they applied to groceries.
The purchase requirement dropping to an average of 1.4 units is its own real signal too, close to a single item threshold rather than a multi unit “buy more to save more” structure. Brands lowered the bar for earning a discount at the same time they raised the discount itself, a combination that only makes sense if the goal was maximizing how many actual shoppers qualified for real savings, not managing down promotional spend.
What Actually Happened to Distribution Channels
Digital coupon redemption jumped 31% in 2023, its highest level ever recorded at that point, while printed newspaper inserts continued a long, steady decline that inflation didn’t reverse. By 2025, digital and load to card offers had officially passed paper as the single most used redemption method for the first time ever, per Inmar Intelligence.
That shift is genuinely about cost structure, not just consumer preference. Printing and physically distributing paper coupons carries a real, fixed cost per unit regardless of whether it gets redeemed, while a digital offer costs a brand nothing until a shopper actually uses it, a meaningfully better economics story during a period when every marketing dollar was under more scrutiny.
Inmar Intelligence, National Retail Federation, and grocery shopping trend survey data, 2024 to 2025.
Manufacturers Fought Back With Digital Rebates
Retailers weren’t the only ones responding, manufacturers had their own real reason to get more aggressive, private label competition. Store brand market share climbed from 18% in 2019 to close to 21% by 2024, and private label food and beverage sales alone rose to $152 billion in 2023, up 6.7% from the year before, continuing to outpace national brand growth again in 2024.
55% of shoppers said they’d increased their private brand purchases over the past year, compared to just 28% who said the same about national brands. For a national brand manufacturer, that meant a coupon wasn’t just a nice to have promotional tool anymore, it was a direct defense against losing a customer to a store brand permanently.
According to a Kantar analysis of promotion trends, 87 of the top 100 CPG manufacturers increased their digital rebate spending during this period, and half of those companies more than doubled their investment. Unlike a retailer’s own clip to card loyalty program, a manufacturer’s own digital coupon, redeemed through a barcode scan or a receipt upload, sends real first party purchase data straight back to the brand, a visibility advantage traditional trade promotions never offered.
The US digital coupon market itself reflects that shift in scale, projected to grow from $8.7 billion in 2024 to $36 billion by 2032, a roughly fourfold increase over less than a decade. That’s not a niche marketing tactic anymore, it’s become a primary channel brands actively invest in specifically because of, not despite, the competitive pressure inflation and private label growth created together.
Which Categories Were Actually Affected
Grocery and Household Staples
Food price inflation has cooled substantially since its January 2023 peak, running around 2.3% to 3.1% through 2025 and into 2026, close to a historically normal range again. Grocery remained the category where coupon activity grew the most during the spike, exactly the pattern of shoppers concentrating their price sensitivity where it mattered most to their household budget.
Apparel, Fashion, and Electronics
These discretionary categories saw the more conservative promotional behavior the original inflation narrative describes, tighter blanket discounts, more emphasis on loyalty programs over one off coupons, and coupons increasingly bundled with a subscription or a larger purchase rather than offered standalone. The mechanism holds here, it just doesn’t apply evenly across every category the way a single flat statistic implies.
Health and Beauty
Beauty and personal care split in a genuinely uneven way too, not a single direction. Makeup and skin care prices actually sit lower now than before the pandemic, while fragrance rose 30% and hair care rose 29% over the same stretch, a real divergence inside one category that a single “beauty coupons declined” or “beauty coupons grew” statement would flatten and get wrong either way.
67% of shoppers globally said they’d likely switch brands specifically because of a lower price, pushing beauty brands toward the same defensive digital rebate strategy already covered above. Checking whether a specific beauty subcategory actually rose or fell in price matters more here than trusting a category wide assumption, since “beauty” as a single label covers products with genuinely opposite price trajectories over the same few years.
How Shoppers Actually Adapted
Brand switching genuinely accelerated through this period, not as a one time reaction but as a sustained shift. 49% of consumers had switched to less expensive brands by November 2024, up from 47% at the start of that same year, and 35% specifically moved from name brands to generic or store brand alternatives, a habit that’s held steady rather than reverting once inflation cooled.
Stacking savings methods together, a coupon plus a store’s own loyalty pricing plus a cashback app, became more common too, since no single discount alone matched what shoppers were used to before prices rose. Timing purchases around known sale events did the same job at the calendar level, concentrating spending into windows where the real discount was deepest.
63% of shoppers reported actively looking for deals more often, and 53% said they noticed fewer items on sale at regular prices even as promotional activity elsewhere increased, a genuinely confusing signal for anyone trying to read the market from shelf prices alone rather than checking actual coupon and rebate availability directly. That gap between what a shopper notices on the shelf and what’s actually available through a coupon or a rebate program is exactly why checking a dedicated source matters more during a period like this one.
What Happens as Inflation Cools
Inflation has genuinely cooled since its 2023 peak, running closer to 2.3% to 3.1% on food through 2025 and into 2026, and overall CPI inflation sitting around 3.4% to 3.5% as of mid 2026. That raises the real question of whether the coupon growth this guide covers reverses now that the original pressure driving it has eased.
The historical precedent above suggests it won’t reverse quickly. Coupon habits built during the 1970s stagflation era persisted for years after inflation itself came down, since a habit formed under financial pressure doesn’t automatically disappear once the pressure lifts. Private label’s market share gains specifically have held steady rather than reverting as inflation cooled through 2024 and 2025, and manufacturers facing that permanent competitive shift have little reason to pull back the digital rebate spending they built up to compete with it.
The more likely path is a permanent shift in how coupons get distributed, digital and targeted rather than broad paper campaigns, alongside a coupon usage rate that settles somewhat below its 2023 to 2024 peak but well above the pre 2023 low point. Watching digital coupon market growth specifically, still projected to nearly quadruple by 2032, is a better forward indicator than watching the headline inflation rate alone.
More overall coupon volume in circulation has a real downside worth naming too, more genuine coupon codes in the wild also means more opportunity for fraudulent or abused codes to hide among them. That’s a genuinely separate problem from the availability question this guide covers, and it’s the specific focus of a dedicated breakdown of the real numbers behind coupon fraud and promotion abuse.
- Check both digital and paper coupons before a shop, paper hasn’t disappeared and still made up the large majority of coupons issued as recently as 2024.
- Prioritize coupon hunting on grocery staples specifically, that’s where face values grew the most during this cycle.
- Stack a coupon with store loyalty pricing and a cashback app rather than relying on any single discount alone.
- Don’t assume smaller brands or store brands lack coupons, targeted digital offers increasingly favor these over broad newspaper style campaigns.
- Recheck category specific behavior before assuming a blanket rule, grocery, discretionary, and beauty categories all responded to this inflation cycle in genuinely different ways.
- Watch the manufacturer’s own app or site directly, not just retailer coupons, since that’s where the biggest recent growth in digital rebate spending actually happened.
Stack Every Real Discount
Check Current Codes Before You Shop
Browse verified deals across grocery, household, and everyday categories to stack on top of store pricing.
✓ Codes verified regularly, no signup required
None of these figures are fixed. Inflation cools, redemption trends shift again, and a data point accurate for 2023 or 2024 can go stale quickly, exactly what happened to the older assumption this rewrite corrected. Recheck the current numbers before repeating any of them as settled fact.
Frequently Asked Questions
Does inflation actually reduce how many coupons are available?
Not in the most recent inflation cycle. Coupon redemption had declined for 12 straight years through 2022, then grew in both 2023 and 2024 as food inflation peaked, the opposite of the common assumption that rising prices shrink couponing.
Did coupon discount values get smaller during high inflation?
No, at least not on food specifically. The average face value of a food coupon rose to $2.74, up 57% year over year, as brands deepened discounts to retain price sensitive shoppers rather than cutting back on them.
How much did food prices actually rise during the recent inflation spike?
Food price inflation peaked at 13.6% in January 2023, the highest level in decades. It’s cooled substantially since, running around 2.3% to 3.1% through 2025 and into 2026, close to a historically normal range.
Are digital coupons now more popular than paper coupons?
Yes, as of 2025. Digital and load to card offers passed paper as the single most used redemption method for the first time ever that year, though paper still accounted for over 40% of redemptions as recently as 2024, it hasn’t disappeared.
Do all product categories respond to inflation the same way when it comes to coupons?
No. Grocery and household staples saw coupon activity and values grow the most during the 2022 to 2024 inflation cycle, while discretionary categories like apparel and electronics saw more conservative, tightened promotional spending, a genuinely different response by category.
Are shoppers actually switching brands to save money during inflation?
Yes, and the trend has held steady rather than reversing. 49% of consumers had switched to less expensive brands by November 2024, up from 47% earlier that year, and 35% moved specifically from name brands to store brand alternatives.
Before You Go
Want the Full Grocery Savings Playbook?
See 20 real, current ways to cut your grocery bill beyond just coupons.
Read the Full Guide